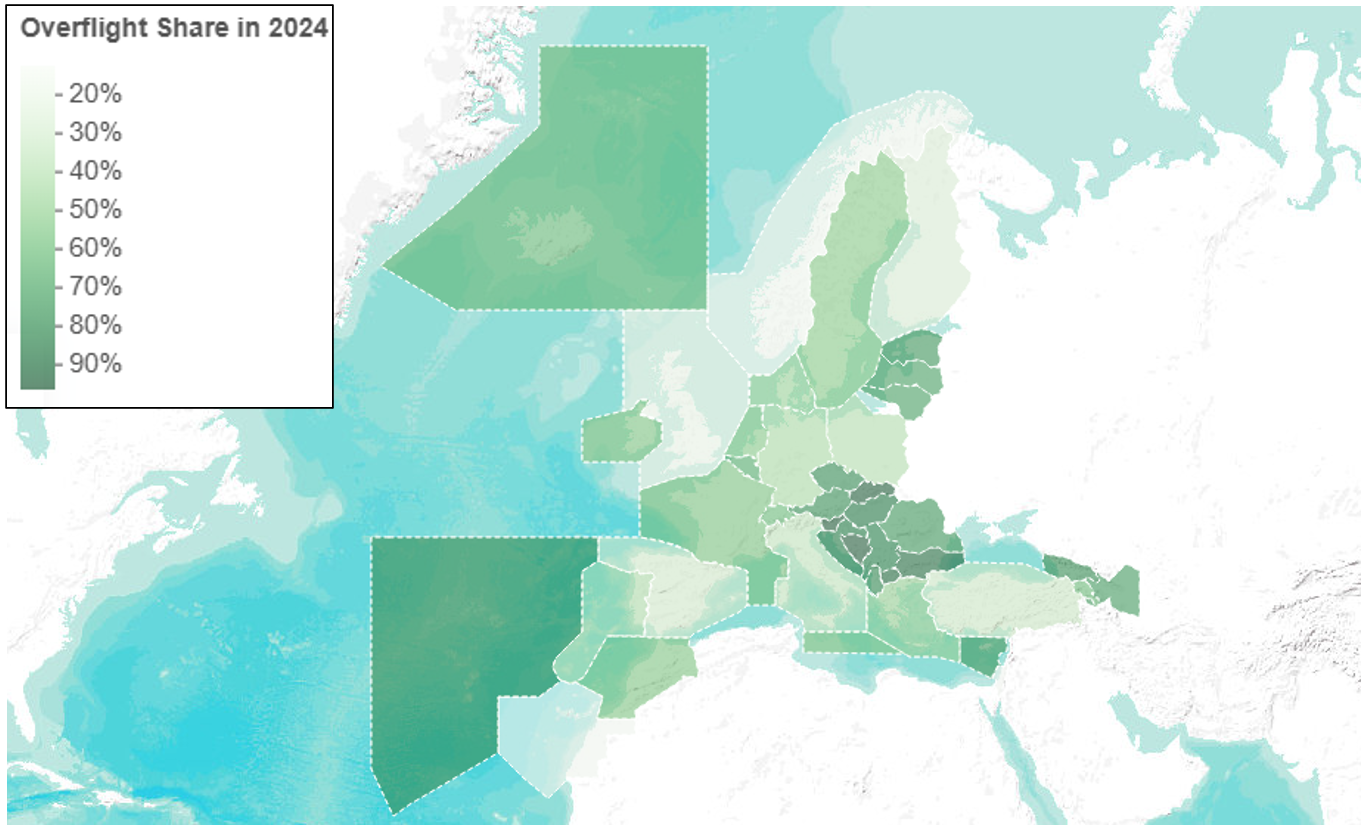
Data Snapshot #52 - Which FIRs (Flight Information Regions) see the most overflights, and why?
Read the article Published July 11, 2025
One-off publication Latest release July 11, 2025
Data and Resources
-
data (API table).csvCSV
Consolidated from the source files in this dataset. Formats are normalised...
-
eurocontrol-data-snapshot-52.pdfPDF
-
eurocontrol-data-snapshot-52.xlsxXLSX
Released 2025-07-11.
-
ds52.pngPNG
-
Read the articleHTML
API
API name: data-snapshot-52
First 5 rows · Download all rows: CSV · TSV · JSON · XML
Code examples
curl
curl 'https://polaris.goens.dev/api/3/action/datastore_search?resource_id=data-snapshot-52&limit=5'Python
import pandas as pd

df = pd.read_csv('https://polaris.goens.dev/datastore/dump/data-snapshot-52?format=csv')
R
df <- read.csv('https://polaris.goens.dev/datastore/dump/data-snapshot-52?format=csv')API documentation and rate limits
Cite this data
Source: EUROCONTROL Aviation Intelligence Unit. Data Snapshot #52 - Which FIRs (Flight Information Regions) see the most overflights, and why?. https://polaris.goens.dev/dataset/data-snapshot-52
May be copied in whole or in part, provided that EUROCONTROL is mentioned as the source and it is not used for commercial purposes. Full disclaimer
Data sources
- Contact
- aviation.intelligence@eurocontrol.int
The table view shows where each column comes from, under Data Dictionary.
Notes from the source
- These data (and much more) can be downloaded from the SID…
Additional Info
| Field | Value |
|---|---|
| Update frequency | One-off |
| Time resolution | |
| Data from | |
| Data to | |
| Data description | https://www.eurocontrol.int/publication/eurocontrol-data-snapshot-52-understanding-overflight-patterns-firs-flight-information |
| Methodology | |
| Source page | https://ansperformance.eu/publications/ectl/datasnap/ |